Total Revaly Value
The Total Revaly Value report provides a comprehensive view of the revenue preserved and generated through Revaly’s payment performance optimization. It includes both realized value from recovered transactions and projected future value from retained customers across each cohort.
This report expands on the high-level metrics shown in the dashboard, allowing for a deeper analysis of how approved and recovered payments contribute to ongoing billing and long-term customer lifetime value.
By default, the report displays data from the last 12 months and converts all values to USD. You can adjust the view using the dropdown options in the top right corner to filter by a specific currency or company.
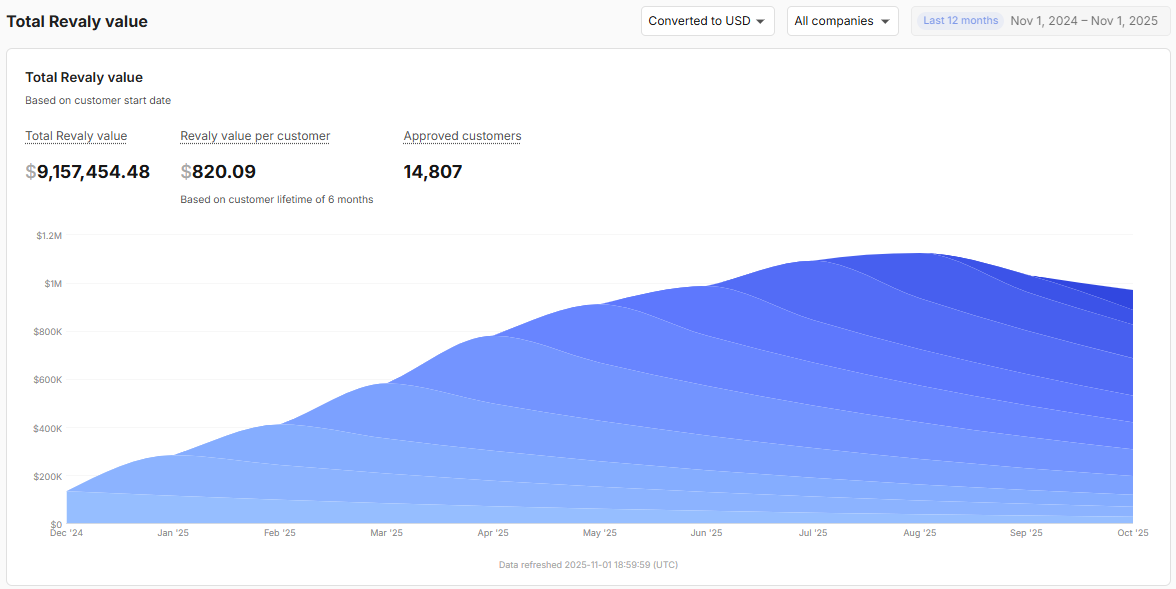
The area chart at the top of the page mirrors the one shown in the dashboard, displaying the estimated revenue contribution of approved customers over time.
- Each curve reflects a historical approved cohort and shows how its projected value is distributed over future months.
- Only the values at the customer start month are factual. All future values represent modeled estimates based on a natural distribution.
- This visualization helps illustrate the long-term value of approved customers and the compounding effect of ongoing retention.
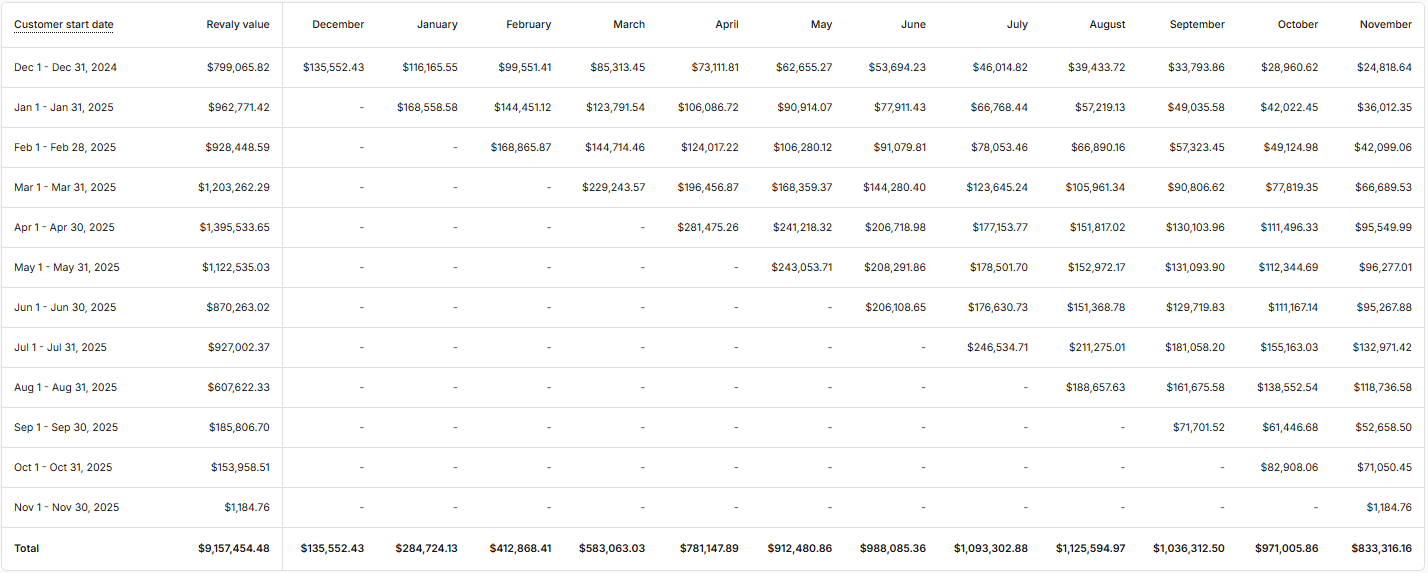
Table Breakdown
Below the chart, the report includes a month-by-month table organized by Customer Start Date, which is the date when a customer with a failed payment entered recovery.
For each cohort (e.g., Dec 2024), you’ll see:
- The Total Revaly Value for the cohort that started recovery that month (the known full value of the recovery).
- How that value is distributed across subsequent months up to present day, shown in each monthly column.
- All figures are expressed in your selected currency and reflect the projected lifetime value of customers recovered in that period.
This table allows for granular analysis of:
- Which cohorts contributed the most value.
- How value is expected to unfold over time.
- Patterns in recovery performance tied to seasonality, campaigns, or operational changes.
ImportantThe charts only include cohorts whose recovery started within the last 12 months. Any projected value from earlier cohorts is excluded.
The projected value is only displayed up to the current calendar month. Any value expected beyond the current month is not shown in the charts