

Repeat Recovery
See how recovery activity is distributed across your customer base and identify patterns that extend beyond a single successful recovery.
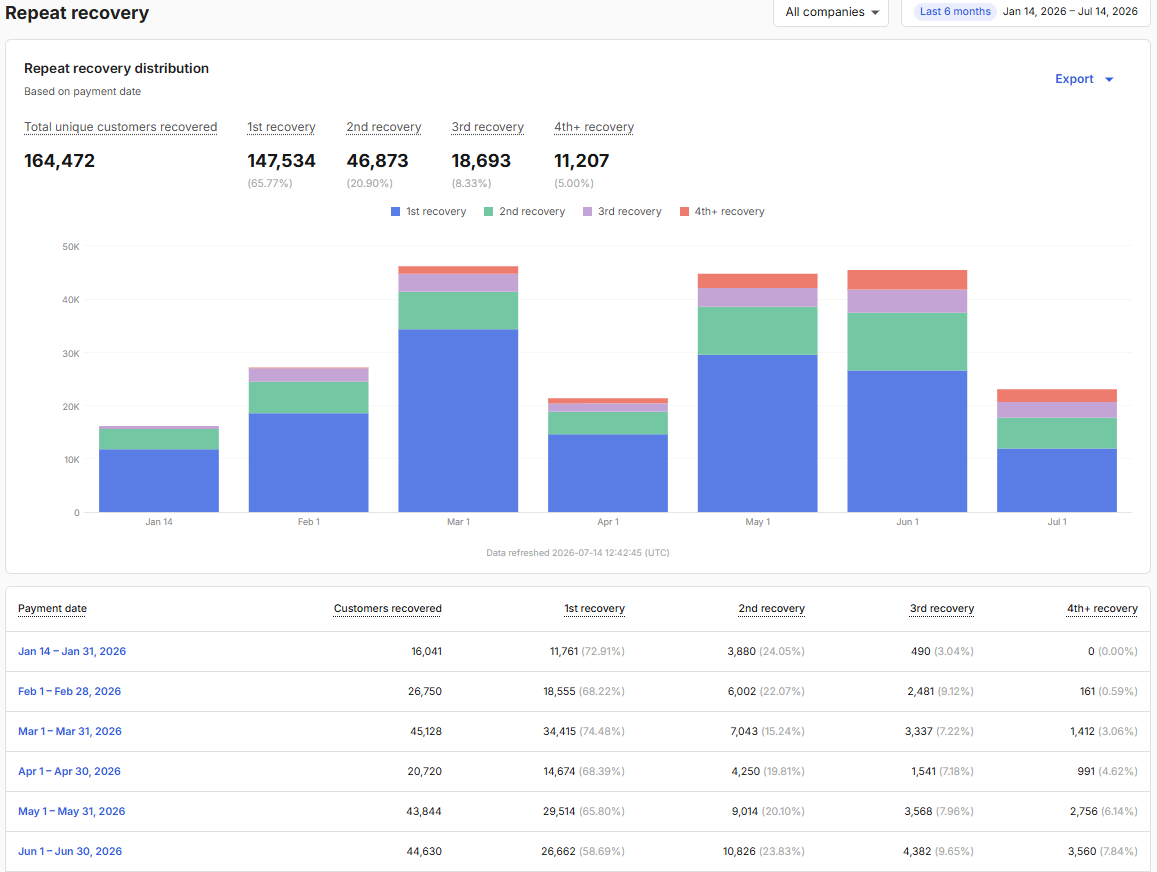
The Repeat Recovery report shows how recovered customers are distributed based on the number of times they have been successfully recovered by Revaly.
Revaly's existing reports help quantify the impact of recovery through retained revenue, customer retention, and Total Revaly Value. The Repeat Recovery report adds another layer of insight by showing how recovered customers are distributed according to their recovery history.
This report turns recovery from a total into a pattern, helping you understand not only how many customers were recovered, but how recovery activity is distributed across your customer base over time.
ImportantRecovery tiers are based on a customer's complete recovery history with Revaly. The selected date range determines which customers appear in the report, but a customer's recovery count always reflects their all-time recovery history.
Understanding Recovery Tiers
Recovered customers are grouped into one of four recovery tiers based on the total number of times Revaly has successfully recovered them throughout their relationship with Revaly.
| Recovery Tier | Description |
|---|---|
| 1st Recovery | Customers recovered for the first time |
| 2nd Recovery | Customers recovered for the second time |
| 3rd Recovery | Customers recovered for the third time |
| 4th+ Recovery | Customers recovered four or more times |
These tiers help visualize how recovery activity is distributed across your customer base and provide additional context beyond total recovered customers or recovered revenue.
Recovery Distribution Chart
The stacked bar chart visualizes how recovered customers are distributed across recovery tiers over time. Each bar represents a reporting period and shows the proportion of customers recovered on their 1st, 2nd, 3rd, and 4th+ recovery.
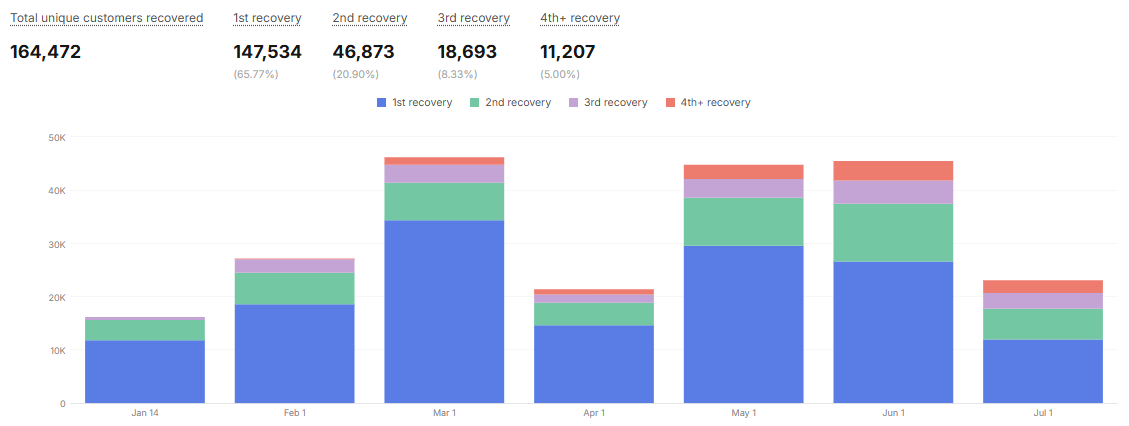
Comparing periods can help identify whether recovered customers are concentrated in first-time recoveries or are increasingly represented by customers who have been recovered multiple times.
Summary Metrics
The summary cards provide a high-level view of the recovery distribution for the selected reporting period.

Total Unique Customers Recovered: The total number of unique recurring customers recovered during the selected date range. This metric includes customers recovered across all recovery tiers and counts each customer only once during the selected reporting period.
Recovery Tier Distribution: The remaining summary cards show how recovered customers are distributed across the recovery tiers described above.
Each card displays:
- The number of customers recovered within that tier.
- The percentage that tier represents out of all recovered customers during the selected period.
Together, these metrics provide a quick snapshot of how recovery activity is distributed across your recovered customer population.
Recovery Distribution Table
The table below the chart provides a period-by-period breakdown of recovery activity.
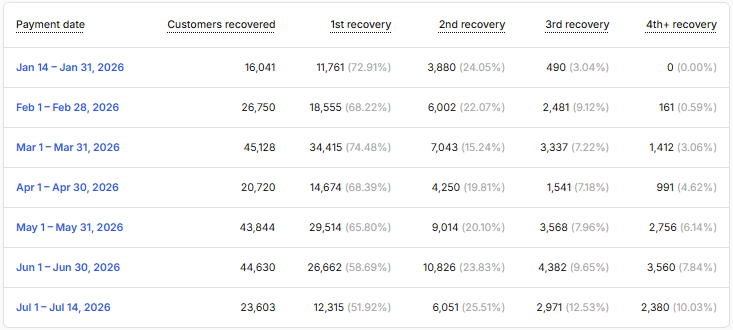
Payment Date: The reporting period represented by the row. Depending on the selected date range, data may be grouped by day, week, or month. Select any reporting period to view a detailed breakdown of recovery activity by day within that period.
Customers Recovered: The total number of unique customers recovered during the reporting period.
Recovery Tier Columns: The remaining columns show how recovered customers were distributed across each recovery tier during the reporting period.
Each value is accompanied by a percentage representing that tier's share of all recovered customers for the selected period.
This detailed view can help identify trends and changes in recovery distribution over time.
Updated 3 months ago